Related
Quick Links
That software crash need not be the end of the journey!
Ideal for end users and debugging newcomers alike.
What IsGDB?
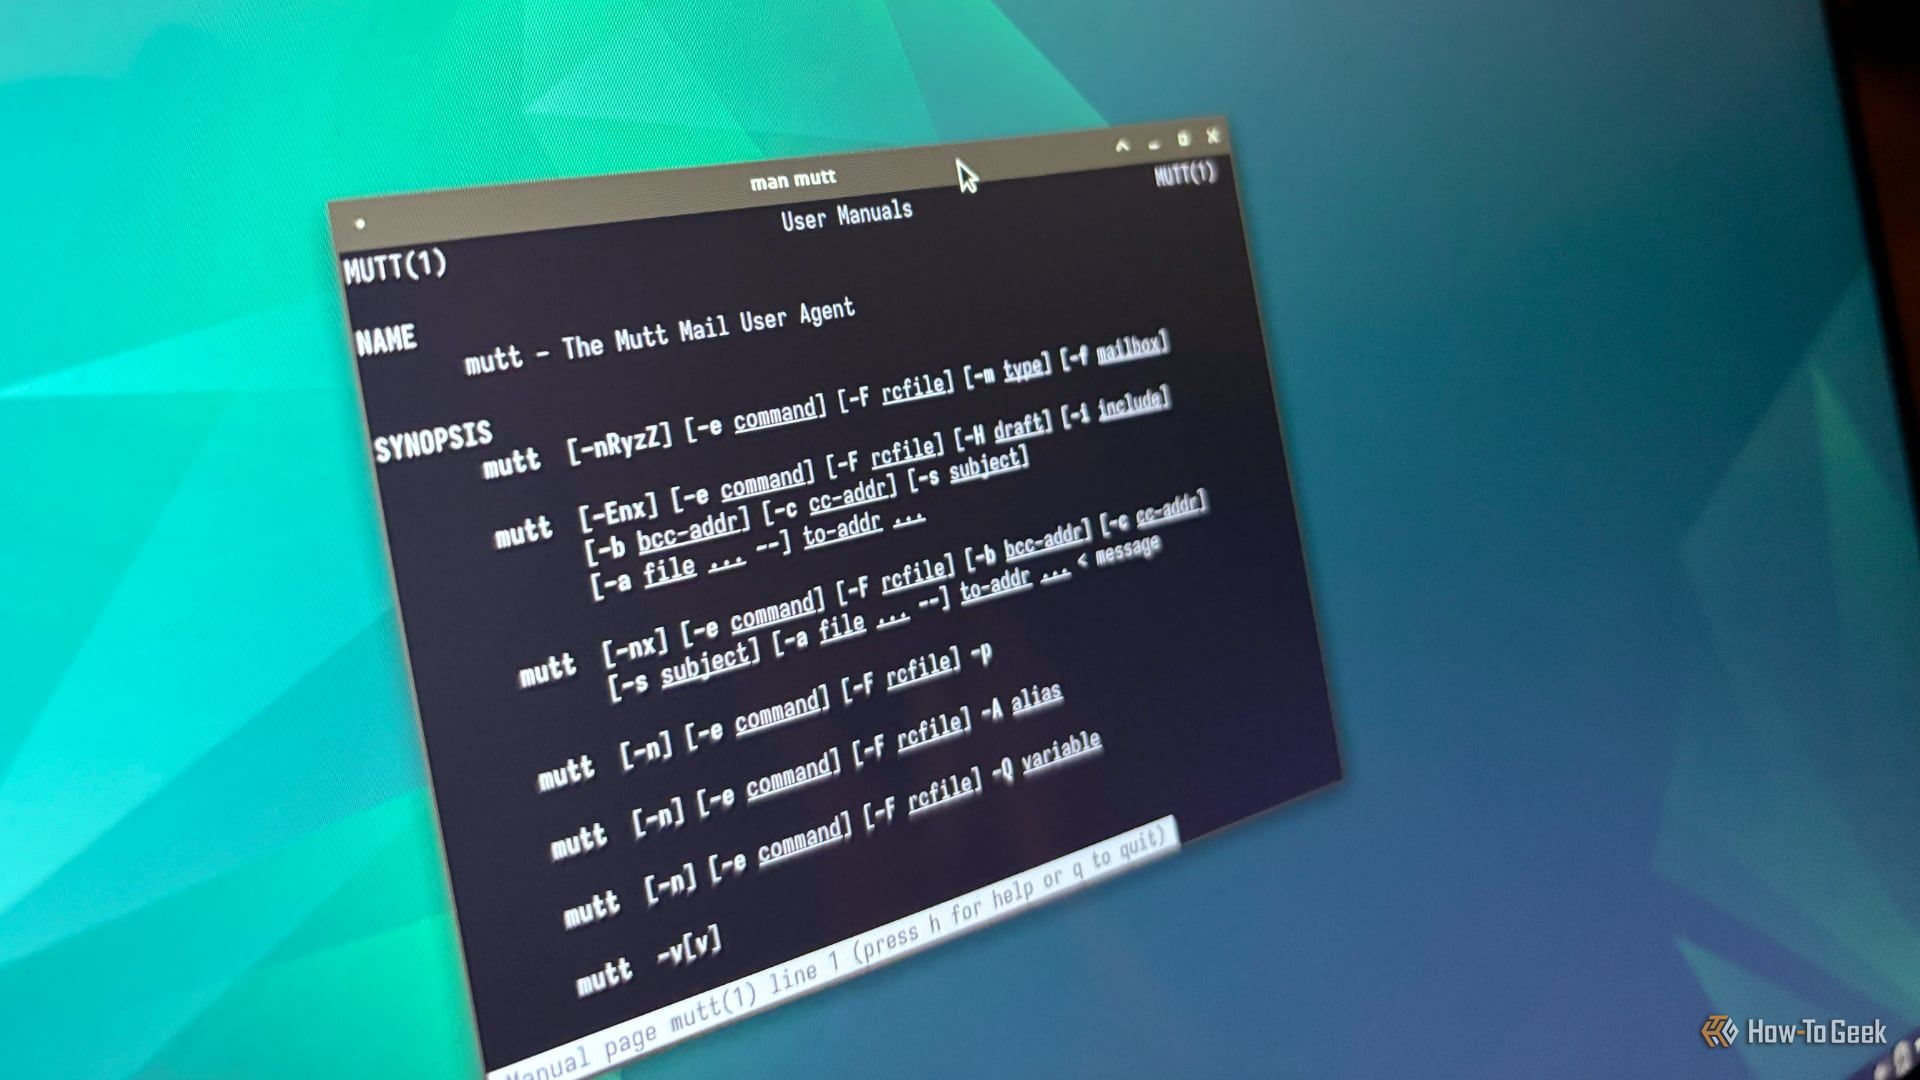
The GDB tool is an old-timer, highly respected, debugging utility in the Linux GNU Toolset.
It is completely free and can be installed easily on all major Linux distributions.
There are three possible scenarios.
Knowing GDB helps tremendously with this task.
This may help to define the bug better and may help to narrow down a test case.
Shutterstock/Nicescene
And, if you are a developer and have never worked with GDB, keep reading.
What Is aCore Dump?
If you ever watched Star Trek and heard Captain Picard (or Janeway!)
It was likely a pun take on Linux core dumping.
A core dump is a binary file, which can only be read by a debugger.
GDB is such a debugger, and one of the best.
No other applications need to be installed for core dumps to be enabled and written whenever an app crashes.
Try and take the same steps in your app to reproduce the crash/issues.
That would be an accurate assessment.
Furthermore, as explained earlier, at times core dump writing can be limited by system resources.
This then brings us to the topic of issue reproducibility.
I once discovered a bug in an Audio driver this way.
GDB can be installed even after a core dump was generated.
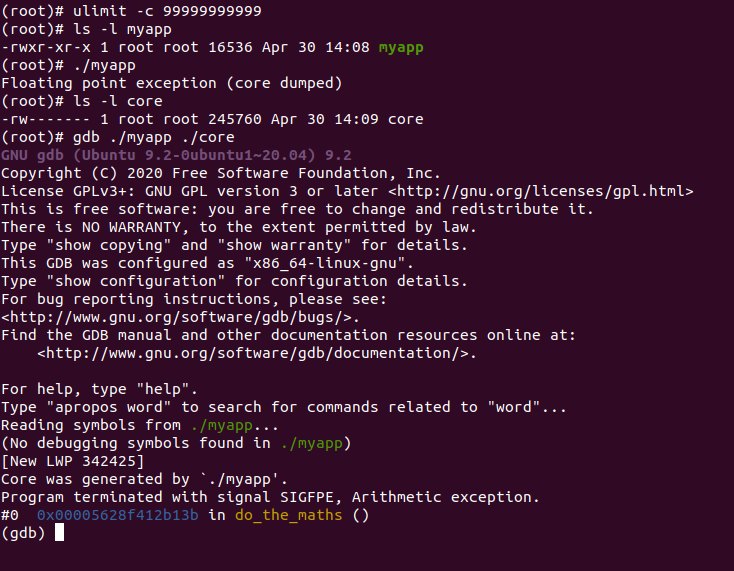
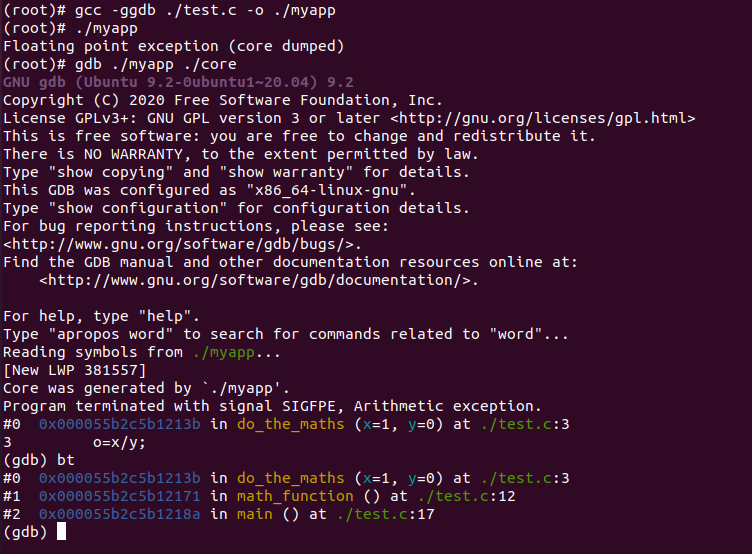
The result is a core dump generated as./core.
We invoke gdb with two options.
The first option is the tool/binary/executable which generated a crash.
The second is the core dump generated by the operating system as a result of the software crashing.
For example, we immediately note that the program terminated due toSIGFPEerror, an arithmetic exception.
Debug symbols is where things can get murky quickly.
Depending on how much was stripped from the resultingoptimizedbinary, even simple function names may not be available.
When function names are not available, function name references will render as?
?instead of the function name.
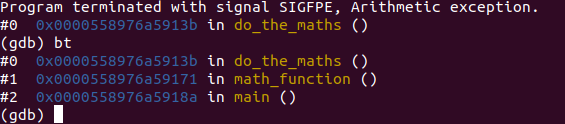
We can see however what the crashing frame/function name is:#0 do_the_maths().
You may be wondering what aframeis.
A single frame is a single function.
So, can we see this stack/frame stack in GDB for our current issue?
Backtrace Time!
Once we have arrived at the gdb prompt, we can issue a backtracebtcommand.
We can see thatmain()calledmath_functionwhich in turn called thedo_the_maths()function.
We can also see the source code lines for all frames.
Studying the output a little, we immediately realize what is wrong.
The variableowas being set to the variablexbeing divided byy.
Furthermore, we have only just scratched the surface of what the cool can do.
how far one can take the GDB journey in each instance.
We discussed the need to configure core dumps on the target system first, and the intricacies thereof.
We saw how to install GDB, allowing us to read and process the generated core dumps.
In a future article, we’ll dive deeper into GDB and explore more advanced GDB use.
