Quick Links
The world today has way too much data, but very little information.
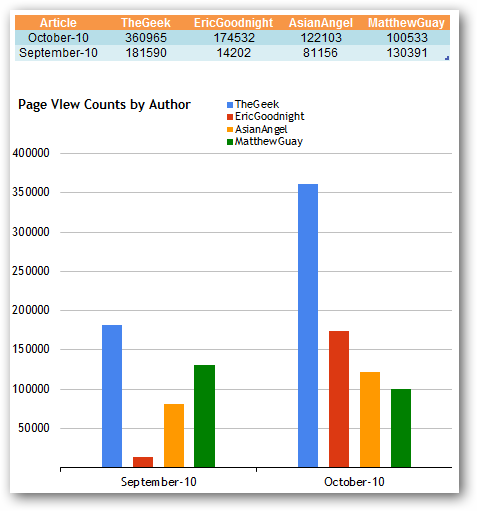
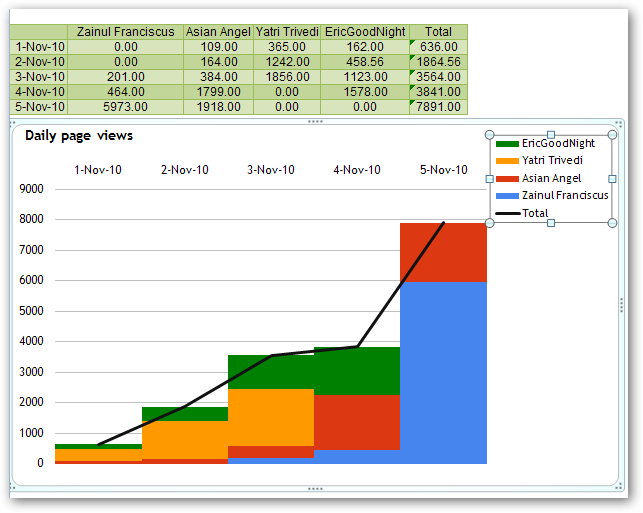
The chart definitely shows how productive the writers have been the past 2 months.
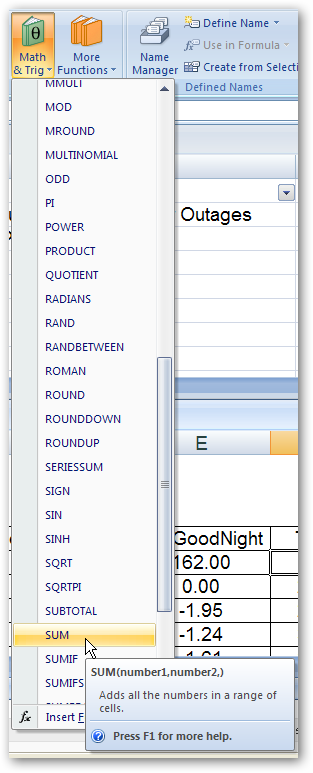
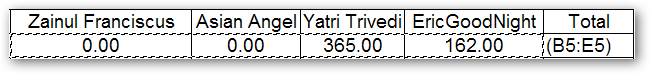
The “sum” function aggregates each writer’s page views under the “Total” column.
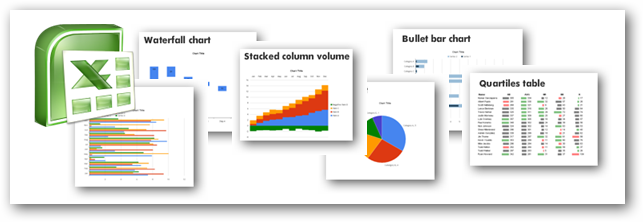
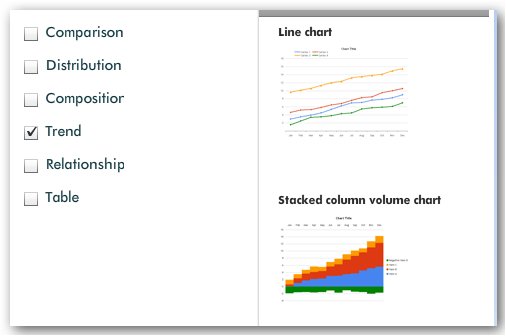
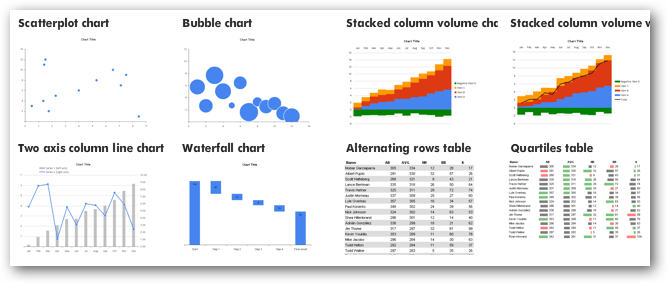
These two charts are not the only charts that we can create.
Juice Analytics has a lot of different custom charts that we can use to present our data.