Quick Links
Enforcement of broadband caps is on the rise.
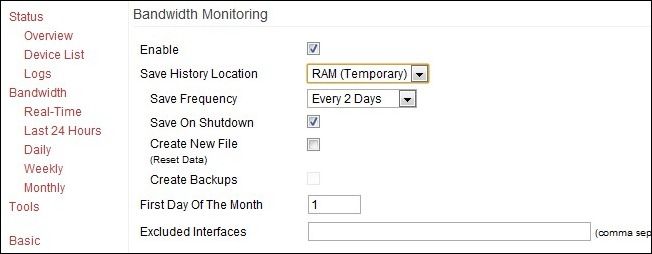
Enabling Bandwidth Monitoring
The very first order of business is turning on the monitoring functionality in Tomato.
Check the box next toEnable.
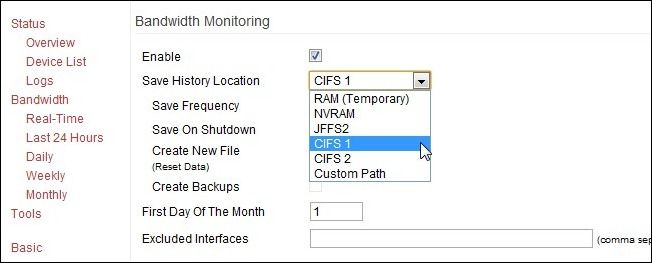
Lets take a look at the Save History Location.
What are these things and what are the positives and negatives to using them?
The downside is that you lose all your data when the router shuts down or crashes.
As the log gets too big the tail end of the log is cut off.
NVRAM:The Non-volatile Random-Access Memory aboard the router.
This is simply RAM that retains the data when the power is off.
Its marginally better than plain old RAM because of this feature but not by much.
You get the benefit of the RAM with a lowered risk of data loss.
JFFS2:The Journaling Flash File System is a portion of NVRAM specifically formatted for file writing.
Theres no sense prematurely wearing out a component in your router when there are alternatives, like CIFS.
CIFS 1/2:Tomato has a small CIFS (Common Internet File System) client built in.
Essentially this allows Tomato to access a Samba/Windows Share share and mount it like a drive.
If you want to archive your logs without worrying about running out of space this is your best option.
It requires minimal configuration which well delve into in the next section.
Custom Path:This simply allows you to create a custom directory within the JFFS2 for your log files.
If youre using the RAM this setting doesnt really matter.
Create New File:Wipes your current file and creates a new one.
Create Backups:Again, just like it sounds.
Will generate backup reports in your specified download directory.
In addition to the regular log saves youll have matching files with a .BAK extension.
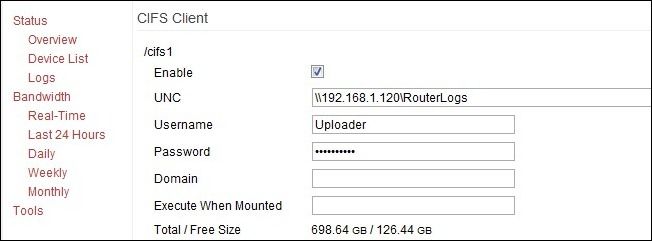
Navigate toAdministration > CIFS Client.
From within the CIFS client menu check theEnablebox under/cifs 1.
\192.168.1.120\RouterLogsdo not use the name of the source on the web connection,use the IP.
Either way you need a login and a password.
The official Tomato documentation recommends against this.
For our purposes leave it blank.
When youve filled in all your information click Save at the bottom.
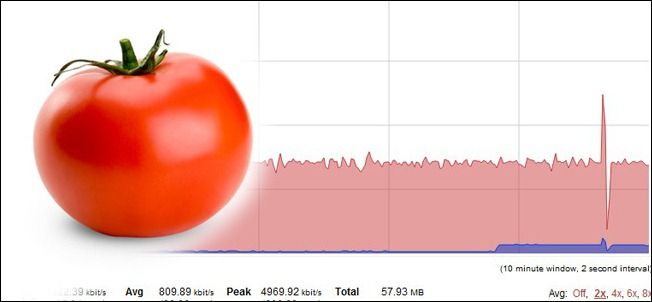
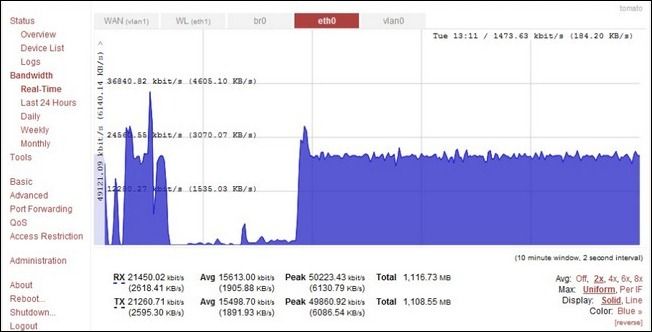
Navigate toBandwidthin the left hand menu within the Tomato GUI.
The default view is real time and should look like the screenshot above.
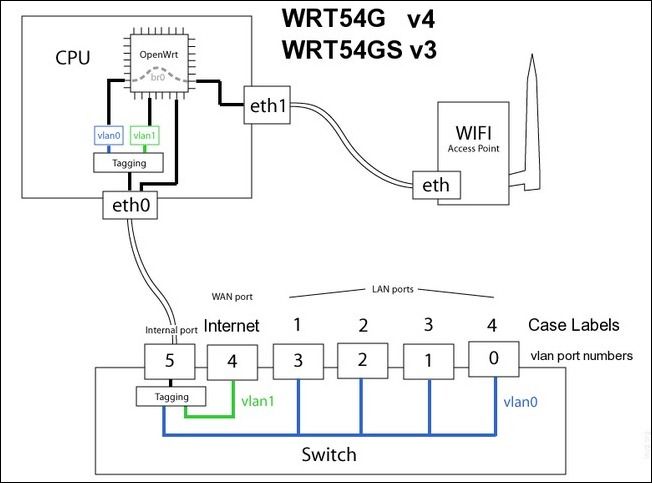
WL (eth1):This is your Wi-Fi traffic.
br0:This is the bridge connection between the WAN and LAN ports.
This tab offers such sweeping view its hard to take in.
vlan0:Not actually a LAN, as it were, despite the lan portion of the name.
Shows the hardwired ports, internet traffic, and internal traffic.
Its handy for seeing both that a large volume of data is coming in and where its going.
In addition to real-time monitoring you could also look at the prior day, week, and month.
